Boot lab: warmth test
Our liner warmth test
- Author: Martino Colonna
- Photographer: Giovanni Danieli
To test the thermal efficiency of the liners we used the same procedure as previous years, recording heat loss with a temperature gradient between the inside and outside of 37°C (98.6°F) to simulate the effect of the liner when the external temperature is 0°C (32°F).
Like with the energy efficiency ratings used for buildings in Europe, an efficiency scale was created to reflect the level of warmth provided, where A is maximum insulation and F is the lowest. The temperature was measured after 5 minutes in the forefoot and heel and an average was calculated, as indicated in the chart. The scale was devised on the basis of intervals of surface temperature and applied equally to all the boots tested, not dividing them by category. To define class A we used the boot with the highest thermal insulation among those tested (Scott Cosmos Pro and Tecnica Cochise 130 DYN GW), while class F used the hypothetical situation whereby the temperature of the liner reached 35°C (95°F, fortunately not registered in any of the boots tested.

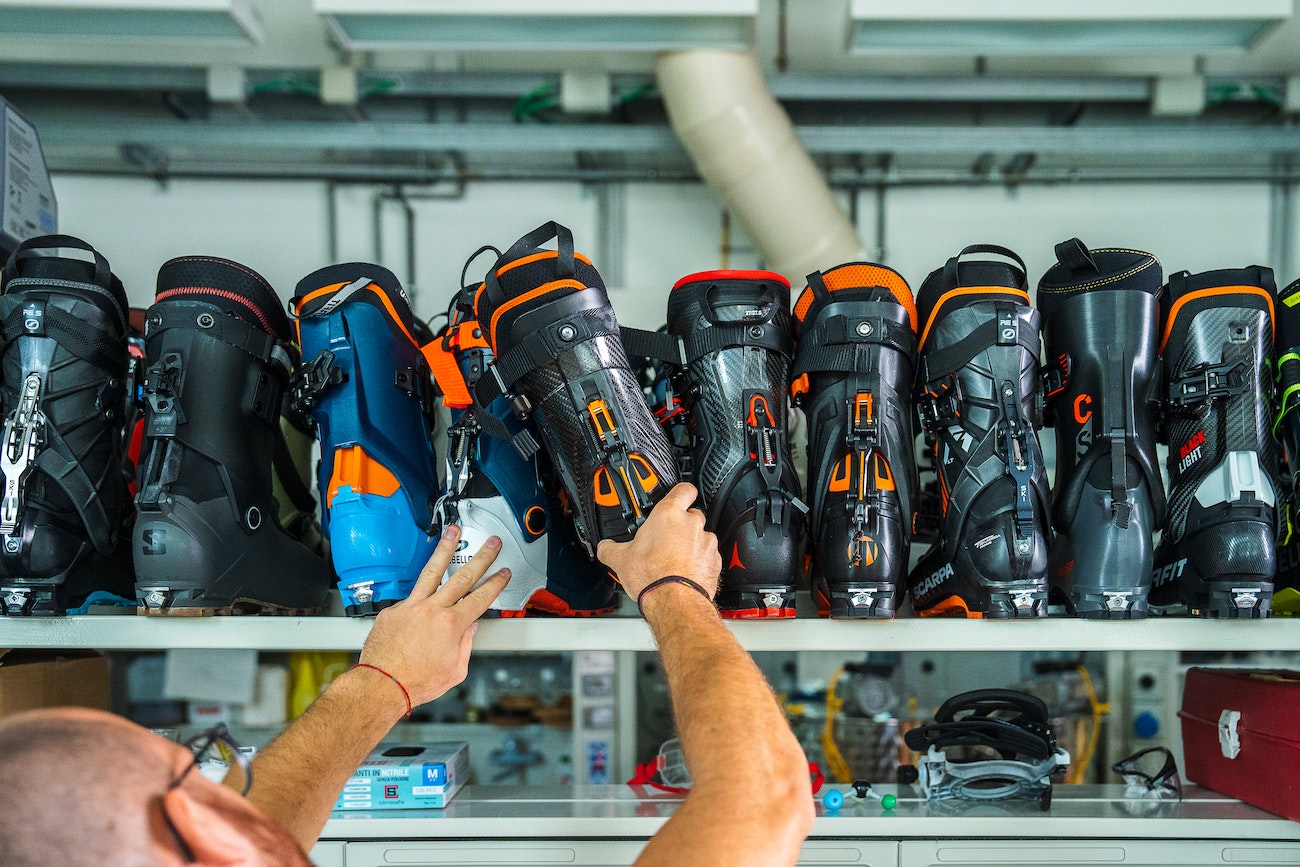
The warmth tests showed how the heavier Freeride boots provide better thermal efficiency on average than their liners, but also how some Tour models (Scott, for example) provide excellent insulation, and that even some Light boots (Salomon MTN) come under class A.

Test protocol
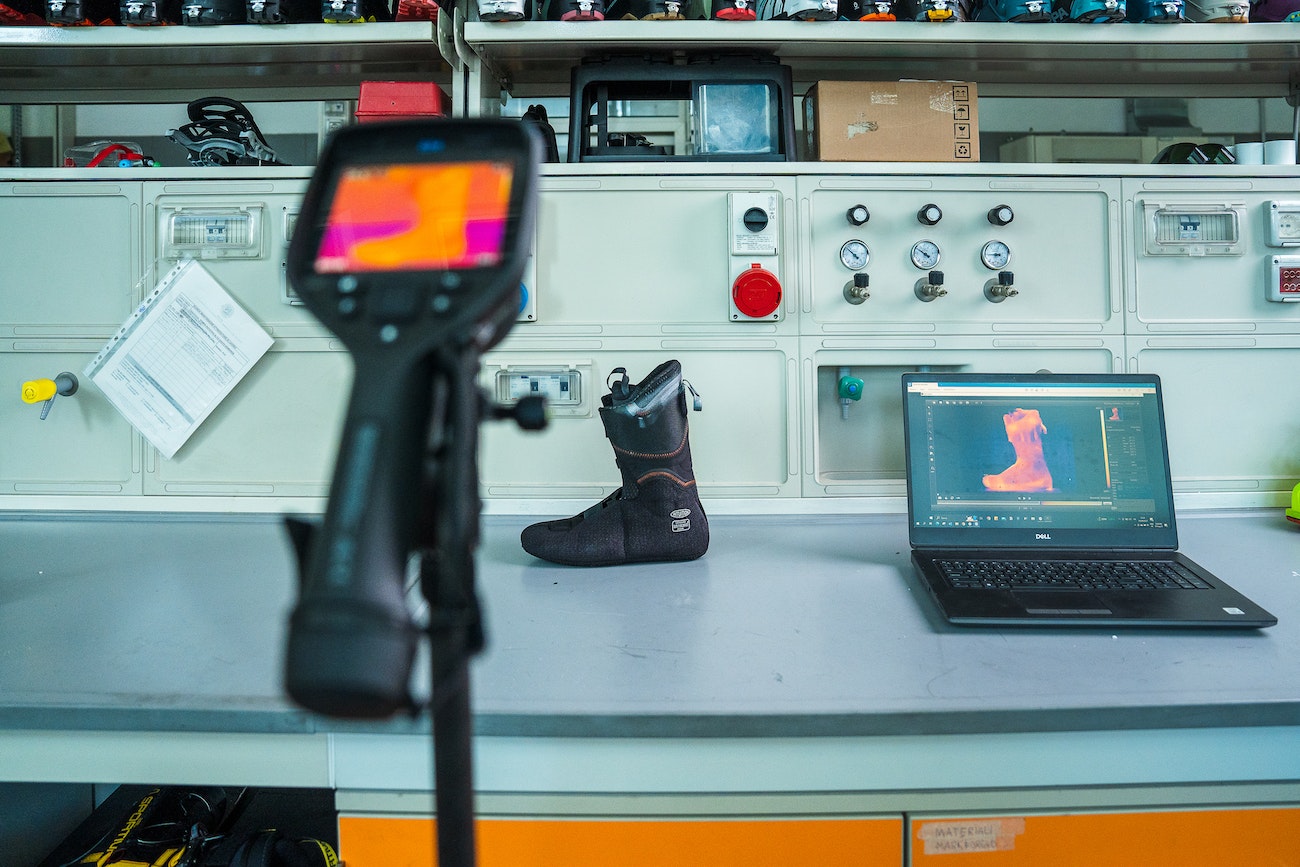
The tests were carried out at the Sport Technology Lab of the DICAM department of the University of Bologna. A FLIR E54 professional thermal imaging camera was used as instrumentation to measure the surface temperature in a range from -20 °C to 110 °C with a sensitivity of 0.1 °C.
The material to be inserted in the slipper was heated to 59 °C in a thermostat oven with a sensitivity of 0.1 °C. One kilogram of substance was placed in the bootie in a thermostatically controlled room at 23 °C (time 0 of the test) and the top was sealed with a polystyrene foam plug, resting the bootie on a stand elevated above the laboratory bench top using a stand. Using the Flir-Tools+ software, thermographs were taken of the outer part in timelapse mode every minute and after five minutes of the inner part and the sole. For the outer, inner and sole zones, two areas were monitored: one front and one rear. The Tools+ software made it possible to select zones within a given area and to measure the average, minimum and maximum temperature of these zones. The area of the measurement areas was kept constant for all shoes.
Share this article

